Average true range
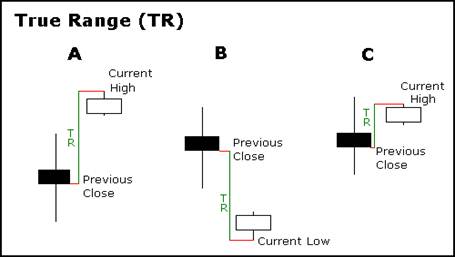
Average true range (ATR) is a technical analysis volatility indicator originally developed by J. Welles Wilder, Jr. for commodities. The indicator does not provide an indication of price trend, simply the degree of price volatility. The average true range is an N-day exponential moving average of the true range values. Wilder recommended a 14-period smoothing
Breakout

A breakout is when prices pass through and stay through an area of support or resistance. On the technical analysis chart a break out occurs when price of a stock or commodity exits an area pattern with an increase volumes.
Chart pattern

A chart pattern or price pattern is a pattern within a chart when prices are graphed. In stock and commodity markets trading, chart pattern studies play a large role during technical analysis. When data is plotted there is usually a pattern which naturally occurs and repeats over a period. Chart patterns are used as either reversal or continuation signals.
Cycles
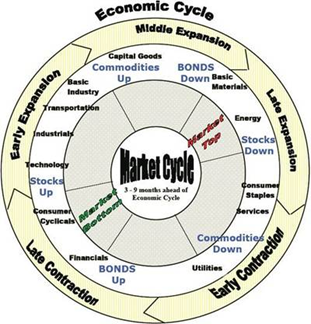
Stock market cycles are the long-term price patterns of the stock market. Time targets for potential change in price action (price only moves up, down, or sideways)
Dead cat
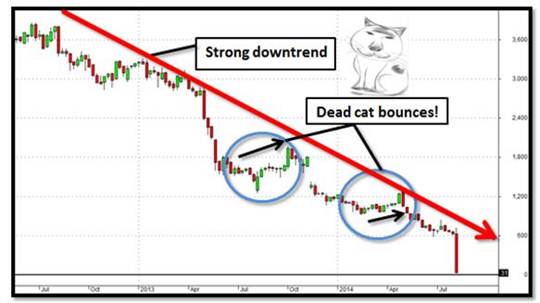
In finance, a dead cat bounce is a small, brief recovery in the price of a declining stock. Derived from the idea that “even a dead cat will bounce if it falls from a great height”, the phrase, which originated on Wall Street, is also popularly applied to any case where a subject experiences a brief resurgence during or following a severe decline.
Elliott wave principle
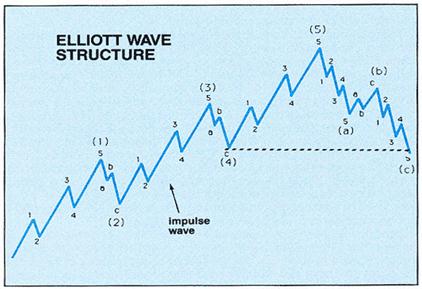
The Elliott wave principle is a form of technical analysis that some traders use to analyze financial market cycles and forecast market trends by identifying extremes in investor psychology, highs and lows in prices, and other collective factors. Ralph Nelson Elliott (1871–1948), a professional accountant proposed that market prices unfold in specific patterns, which practitioners today call Elliott waves, or simply waves. Elliott published his theory of market behavior in the book The Wave Principle in 1938, summarized it in a series of articles in Financial World magazine in 1939, and covered it most comprehensively in his final major work, Nature’s Laws: The Secret of the Universe in 1946.
Fibonacci ratios
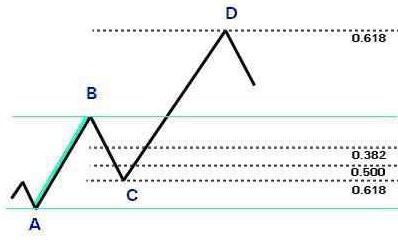
Fibonacci retracement is a method of technical analysis for determining support and resistance levels. They are named after their use of the Fibonacci sequence. Fibonacci retracement is based on the idea that markets will retrace a predictable portion of a move, after which they will continue to move in the original direction.
Momentum
Momentum and rate of change (ROC) are simple technical analysis indicators showing the difference between today’s closing price and the close N days ago. Momentum is the absolute difference in stock, commodity.
Point and figure analysis

Point and figure (P&F) is a charting technique used in technical analysis. Point and figure charting is unique in that it does not plot price against time as all other techniques do. Instead it plots price against changes in direction by plotting a column of Xs as the price rises and a column of Os as the price falls.
Support and Resistance
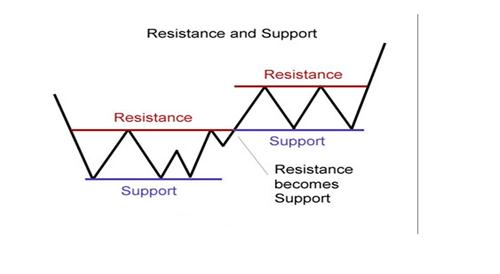
A support level is level where the price tends to find support as it is going down. This means the price is more likely to “bounce” off this level rather than break through it. However, once the price has passed this level, by an amount exceeding some noise, it is likely to continue dropping until it finds another support level.
A resistance level is the opposite of a support level. It is where the price tends to find resistance as it is going up. This means the price is more likely to “bounce” off this level rather than break through it. However, once the price has passed this level, by an amount exceeding some noise, it is likely that it will continue rising until it finds another resistance level.
Trending
A market trend is a tendency of financial markets to move in a particular direction over time. These trends are classified as secular for long time frames, primary for medium time frames, and secondary for short time frames. Traders identify market trends using technical analysis, a framework which characterizes market trends as predictable price tendencies within the market when price reaches support and resistance levels, varying over time.
