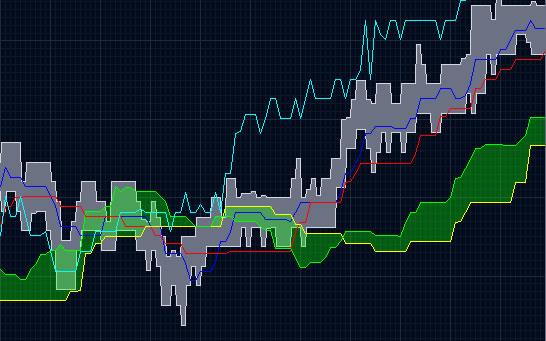
Ichimoku Kinko Hyo is a technical indicator developed by a Goichi Hosoda, a journalist in the 1960’s. Ichimoku literally translates to ‘one glance’ – suggesting the multi-faceted aspect of this indicator, Kinko means “balanced” Hyo indicates “charts”. If we put together in a single sentence “One glance balanced chart”. The Ichimoku indicator suggests support and resistance levels, trend bias as well as giving entry and exit signals for trades. Cloud Charts add an essential tool for analyzing near-term areas of support and resistance. Tenkan and Kijun line crossovers can be used as entry and exit signals. When price is trading above the Kumo (cloud) the trend bias is bullish, when below the Kumo bias is bearish.
This indicator mainly consists of Five components:-
- Tenkan sen
- Kijun sen
- Chikou span
- Senkou span 1 Kumo (Cloud)
- Senkou span 2
Kijun-sen and Tenkan-sen are trend indicators.
Tenkan span: – Tenkan-sen indicates the direction of the trend. If the Tenkan-sen is flat, the market is in a non-trending channel.
Tenkan Line (highest high + lowest low)/2 calculated over last 9 periods.
Kijun-sen: – When the prices are above the Kijun-sen, it is likely to continue the up trend and the vice versa.
Kijun Line (highest high + lowest low)/2 calculated over last 26 periods
Kumo (Cloud):- It is mainly consists of two components Senkou span A or 1 and Senkou span B or 2.The Senkou Spans are supports and resistances line on the price chart. When the prices are within the Cloud, the market is non-trending. Likewise, when the prices are above the cloud it gives a bullish trend. Meantime, higher span act as a support levels and the lower span formed the second support levels for the prices. Conversely, if the prices are below the Cloud, the lower Span is considered as the first resistance level and the higher Span as second resistance level.
- Senkou Span A (Tenkan line + Kijun Line)/2 plotted 26 time periods ahead
- Senkou Span B (highest high + lowest low)/2 calculated over past 52 time periods, sent 26 periods ahead
Chikou span:-This line is used to determine the strength of the buy or sell signal. If the Chikou Span was below the closing price and a sell signal was issued, then the strength is with the sellers, otherwise it is a weak signal. Conversely, if there was a buy signal and the Chikou Span was above the price, and then there is strength to the upside, otherwise it can be considered a weak buy signal. This feature can also be incorporated into the other signals.
Chikou Span (most current closing price plotted 26 time periods back)
Interpretation:-

There are different levels of strengths for the buy and sell signals of an Ichimoku chart. First, if there is a bullish crossover signal and prices trading above the Kumo, would be considered as a strong buying signal. In contrast, if there is a bearish crossover signal and the prices trading below the Kumo, suggesting strong bearish trend for the prices. Secondly, if the prices are trading within a Kumo range and any cross over in the chart would be respective buying or selling signal for the prices. Thirdly, a weak buy signal would be issued if there was a bullish crossover that occurred while the price was trading below the Kumo. On the other hand, a weak signal would be issued if there was a bearish crossover that occurred when the price was trading above the Kumo.
