Nowadays, we are living into fast paced environment where technology plays a big role and these things have big impact on our minds. Here, with technology, we mean the news & media which makes the news too big (particularly in financial sector) that investor/trader may not be able to take correct decision.
Here we are going to explain something which is not easy to apply as the noise from media is too high that it manipulates our views. But, if the application is correct huge profits can be made in financial markets with the help of this strategy.
We must have heard about multiple time frame strategy many times but we may not know about the proper application. This strategy basically aims to catch the larger trend and reap benefits from it. There would definitely be 2-3 time-frames involved while come out with a decision. But we will simply define it with 2 time frames – daily and weekly. We explain it with the help of simple example on NIFTY weekly and daily chart.
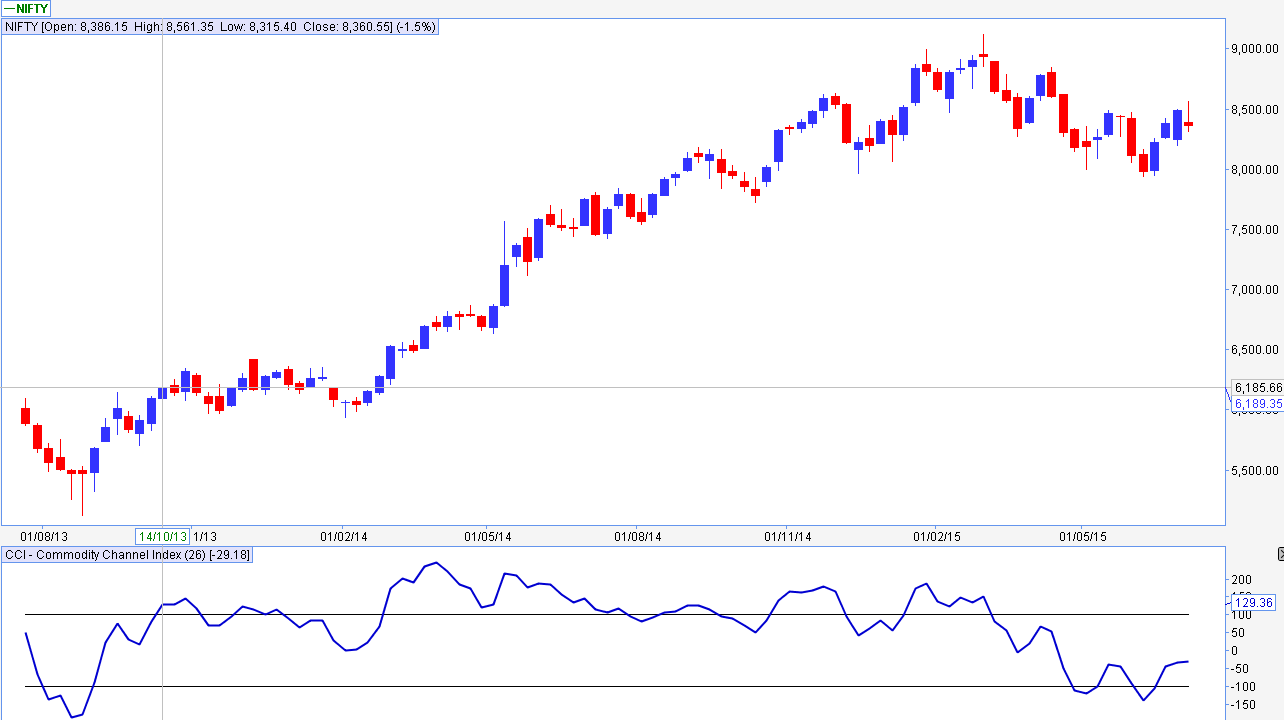
In the above weekly chart of NIFTY the trend change was signaled by CCI going above 100. It means the new up trend is beginning. But as the index is near to resistance so would it be better to take entry at the resistance areas. It sometimes proves to be good but waiting for the right entry is the better option most of the times. We are clearly seeing the markets making bottom after 16 weeks. We can describe it as the bottom as most of the analysts do when they actually know that 5933.30 was the bottom in NIFTY. We are not going to discuss the same. As we are going to capture the larger trend with entry based on shorter time-frame charts, so, we will take a snapshot of daily chart of NIFTY for that purpose.
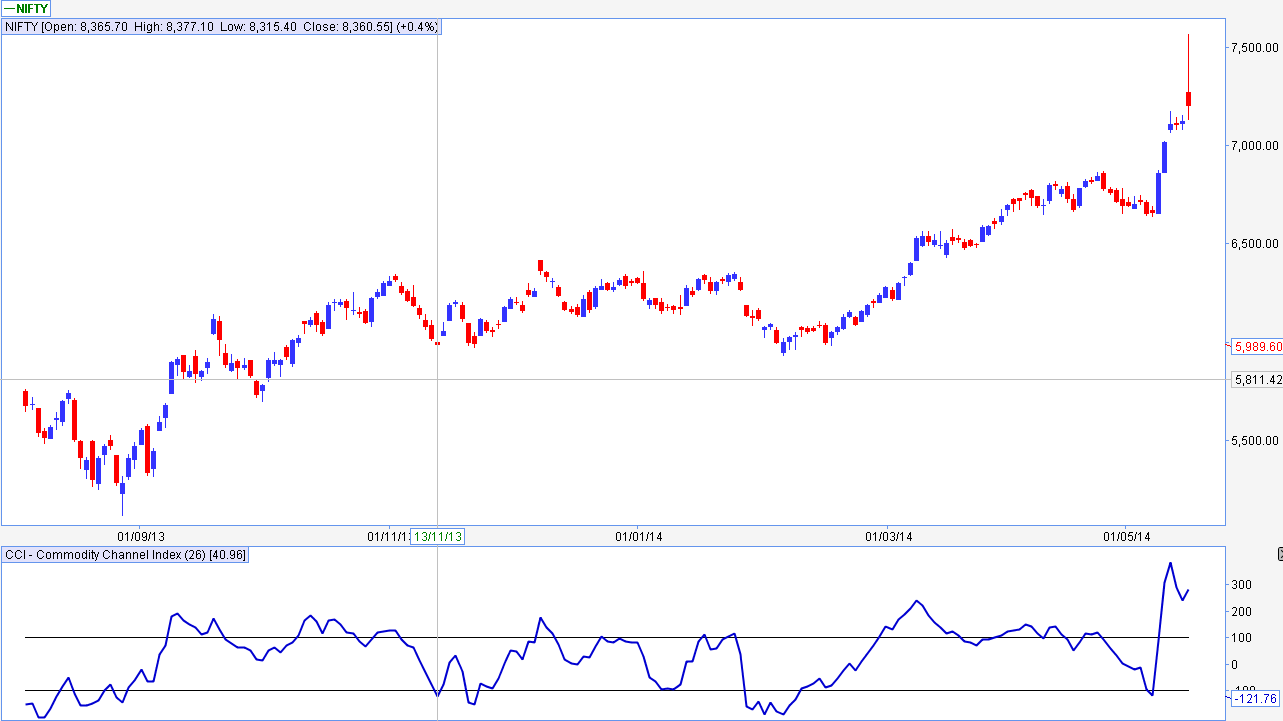
In the above daily chart of NIFTY, CCI went below -100 which signals selling but we should not do that else we will look to buy at those points as markets may be near the support areas and markets behaved exactly what we are talking about. Oops, we missed the entry there. No worries, CCI came back below -100 and NIFTY too near the same prices forming double-bottom there. Yes, we can take buy entry there. News channels and media may not be able to take this position as there may be bad news from all over the world. We don’t exactly know what news was flashing at that time. But if someone would go back and find the news, the same things will be discussed by the news channels.
We would have taken buy entry near those prices as markets may or may not come at those prices 3rd time. In this case it did but we don’t know if it wouldn’t have come. Many of you would wonder why we used 26 period CCI, the larger time-frame always gives better picture. In the coming blogs, we will discuss how to select the time-frame for indicators.
Here, we have discussed with one indicator, we can do the same with different indicators like Super trend, RSI, MACD etc. where longer time-frame defines larger trend while shorter time-frame allows better entry. We can use this too for intraday trading where hourly chart will tell us about larger trend while 15-min. chart giving us better entry prices.
