- Inverse Head and Shoulders
An inverse head and shoulders pattern is formed after a downtrend. Its completion marks a reversal pattern and it is formed of three troughs, the middle trough (head) being the lowest and the other two outside peaks (shoulders) being shallower and roughly equal. The reaction highs of each trough can be connected to form a neckline and the break of which completes the formation of this pattern.
Left Shoulder: A trough is formed in a downtrend which is marked as left shoulder. At this point of time this is the lowest point of the trend. The reaction high after that trough marked as 1 completes the shoulder. The rise usually remains below the trend line which keeps the prevailing trend intact.
Head: From the reaction high of left shoulder again the fall begins and marks a new trough lower than previous one (left shoulder). After bottoming, the reaction high from this trough marked as 2 forms the second point of neckline. This high generally breaks the down trend line which signals prevailing trend in danger.
Right Shoulder: The fall from the high of the head forms the right shoulder. This trough is higher than the head and usually matches the low of the left shoulder. Though symmetry is preferred, sometimes this is not in order. Now, the rise from right shoulder should break the neckline formed by joining points 1 and 2.
Volume: Volume plays important role in confirmation of this pattern. Though this should not be used as rule. Ideally, but not always volumes during the formation of left shoulder should be higher than during the formation of head. The decrease in volumes during head formation is a warning sign. The next warning comes when volumes increases during rise from the head. And, the final confirmation comes when volumes increases during rise from right shoulder and volumes expand heavily during the breakout of neckline.
Target: The price target of this pattern can be measured by deducting the distance from the neckline to low of the head and adding it to the breakout point of neckline.
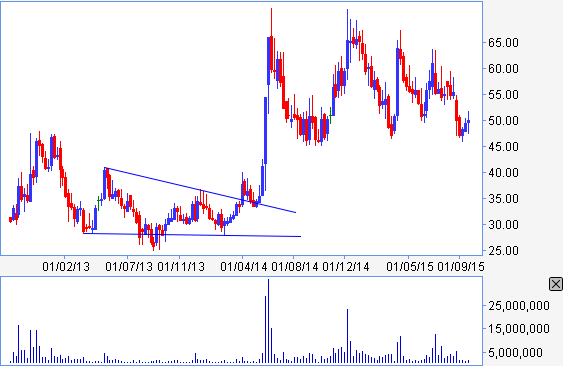
The above weekly chart is of NETWORK18 and the pattern was formed in the year 2013-14 only which achieved its target in some weeks from the breakout.
In this case, though volumes gave confirmation during the breakout and even the volumes form this a perfect pattern.
- Double Bottom
The double bottom is a major reversal pattern that is formed after an extended downtrend. The pattern is formed of two consecutive troughs that are probably equal, with a peak in-between.
Though there can be variations, but the classic double bottom marks at least an intermediate or long-term trend change from bearish to bullish. Many potential double bottoms can form along the way up, but until key resistance is broken, a reversal cannot be confirmed. To clarify, we will look at the main points in the formation and then brief through an example.
Prior Trend: With any reversal pattern, there has to be a prevailing trend to reverse. In the case of the double bottom, a significant downtrend of several months should exist.
First Trough: The first trough should mark the lowest point of the current trend. As such, the first trough is fairly normal and the downtrend is not in question at this time.
Peak: After the first trough, a rise takes place that typically ranges from 10 to 20%. Volume on the rise from the first trough is usually not significant. The highs are sometimes rounded or drawn out a bit, which can be a sign of rising demand.
Second Trough: The decline from the peak usually happens with low volume and meets support from the previous low. Support from the previous low should be expected. Even after meeting support, only the possibility of a double bottom exists. The pattern still needs to be confirmed. The time period between troughs can vary from a few weeks to many months, with the norm being 1-3 months. While exact troughs are preferable, there is some leeway. Usually a trough within 3% of the previous low can be considered as valid one.
Advance from Trough: The subsequent rise from the second trough should witness an expansion in volume and/or an accelerated descent, perhaps marked with a gap or two. Such a rise shows that the forces of demand are stronger than supply and marks an important indication of trend change.
Resistance Break: Even after trading up to resistance, the double bottom and trend reversal are still not complete. Breaking resistance from the highest point between the troughs completes the double bottom. This too should occur with an increase in volume and/or an accelerated ascent.
Resistance Turned Support: Broken resistance becomes potential support and there is sometimes a test of this newfound support level with a correction. Such a test can offer a second chance to exit a short position or initiate a fresh long.
Price Target: The distance from resistance breakout level to trough can be added to the resistance breakout level for a price target. This would infer that the bigger the formation is, the larger the potential rise.
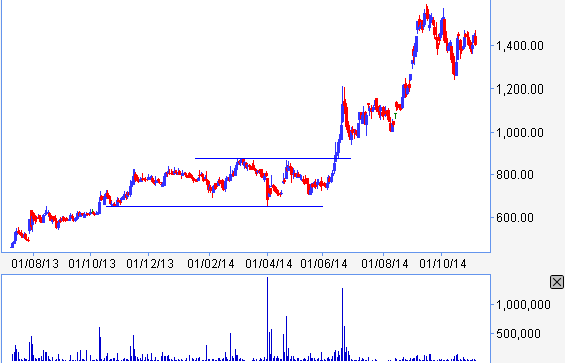
In the above daily chart of NATCOPHARM in the year 2013-14, the lows of 650 were exactly same. The peak of the pattern was at 878. After the breakout, the broken resistance of 878 became support and stock tested 880 levels after 2-3 trading sessions and achieved the target of double bottom easily in some months.
In this case, volumes were also confirming the pattern where during breakout volumes were extending.
