Technical Indicators
The Technical indicators are often helpful in determining the strength of the trend and also it provides the trend reversal cues. In general the technical Indicators are plotted above or below technical price chart. In this article we are going to explain about the Relative strength index (RSI-14).
The J.Welles Wilder Introduced the Relative strength index. It is a momentum oscillator which measures the speed and change of price movements. The RSI momentum indicator moves between the zero and 100. Traditionally, and according to Wilder, RSI is considered overbought when above 70 and oversold when below 30.
Calculation
RS= Average Gains/Average loss
RSI=100- 100/1+RS
To simplify the calculation explanation, RSI has been broken down into its basic components: RS, Average Gain and Average Loss. The RSI calculation is based on 14 periods, which is the default suggested by Wilder.
The very first calculations for average gain and average loss are simple 14 period averages.
- First Average Gain = Sum of Gains over the past 14 periods / 14.
- First Average Loss = Sum of Losses over the past 14 periods / 14
The second, and subsequent, calculations are based on the prior averages and the current gain loss:
- Average Gain = [(previous Average Gain) x 13 + current Gain] / 14.
- Average Loss = [(previous Average Loss) x 13 + current Loss] / 14.
Andrew Cardwell developed positive and negative divergence while using the RSI,
- Positive Divergence
- Negative Divergence
- Hidden Divergence
Positive divergence:

A positive divergence forms when RSI forges a lower low and the commodity forms a higher low. In the mentioned price chart it is visible that silver prices had created a new low at 34455 on 9/15/2015 at the point of time RSI-14 had failed to breach previous low. These kind of formations are considered as positive divergence. Usually positive divergences are trend reversal pattern.
Negative Divergence:
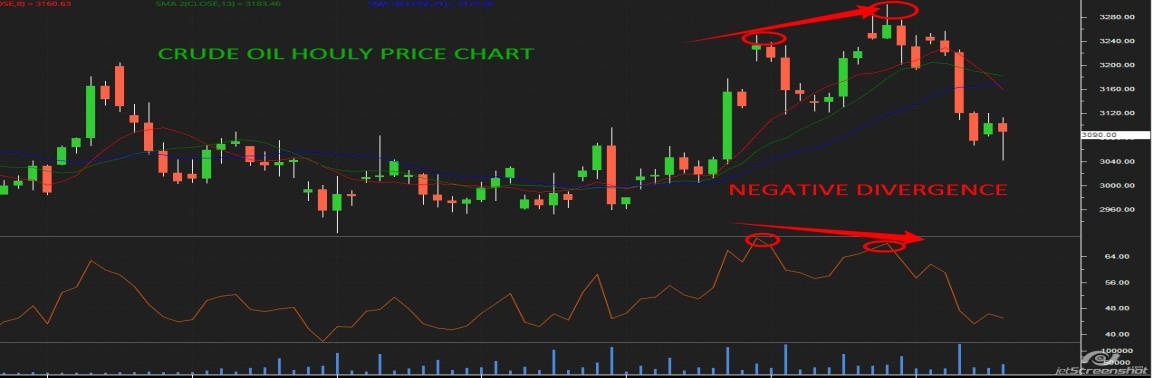
A negative divergence forms when RSI makes higher lows and commodity makes the higher highs. In the mentioned price chart it is visible that prices had a new high of 3255 and RSI-14 had failed to breach previous high. Thus this is the valid negative divergence. Negative divergence is the trend reversal points.
Hidden divergence:
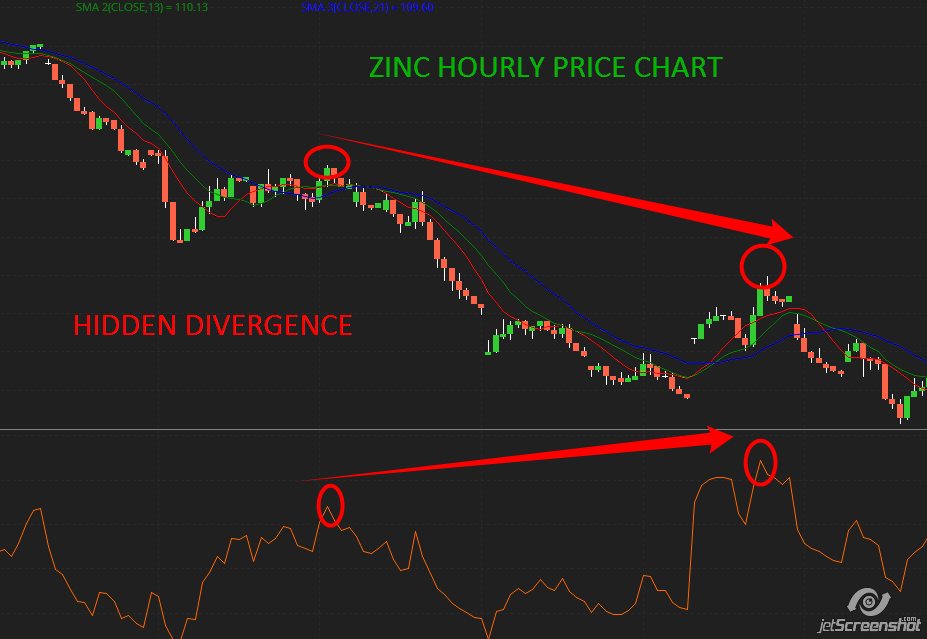
The above discussed two type of divergences positive and negative are the trend reversal patterns but hidden divergence is a tend continuation pattern. After a price rise or a fall it rebounds, in technical term it is considered as pullbacks. In this pullback price fails to breach previous highs but where RSI-14 breaches the previous tops and reverse in rising markets. In the above motioned price chart it is visible that prices had filed to breach previous highs but RSI-14 had breached the previous tops, thereafter prices had continued its bearish rally. Thus this is a clear hidden divergence, usually it is considered as trend continuation pattern.
