- Head and Shoulders
A head and shoulders pattern is formed after an uptrend. Its completion marks a reversal pattern and it is formed of three peaks, the middle peak (head) being the highest and the other two outside peaks (shoulders) being low and roughly equal. The reaction lows of each peak can be connected to form a neckline and the break of which completes the formation of this pattern.
Left Shoulder: A peak is formed in an uptrend which is marked as left shoulder. At this point of time this is the highest point of the trend. The reaction low after that peak marked as 1 completes the shoulder. The decline usually remains above the trend line which keeps the prevailing trend intact.
Head: From the reaction low of left shoulder again the rise begins and marks a new peak higher than previous one (left shoulder). After peaking, the reaction low from this peak marked as 2 forms the second point of neckline. This low generally breaks the trend line which signals prevailing trend in danger.
Right Shoulder: The advance from the low of the head forms the right shoulder. This peak is lower than the head and usually matches the high of the left shoulder. Though symmetry is proffered, sometimes this is not in order. Now, the decline from right shoulder should break the neckline formed by joining points 1 and 2.
Volume: Volume plays important role in confirmation of this pattern. Though this should not be used as rule. Ideally, but not always volumes during the formation of left shoulder should be higher than during the advance of head. The decrease in volumes during head formation is a warning sign. The next warning comes when volumes increases during decline from the head. And, the final confirmation comes when volumes increases during decline from right shoulder.
Target: The price target of this pattern can be measured by deducting the distance from the neckline to top of the head from the breakout point of neckline.
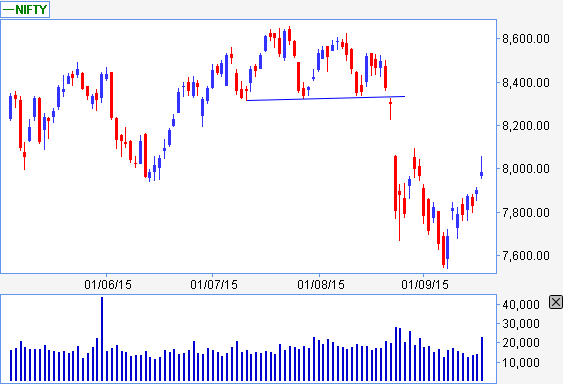
The above chart is of NIFTY and the pattern was formed in near past only which achieved its target in just 2 days from the breakout.
In this case, though volumes didn’t confirmed the pattern but we already mentioned that it should not be used as a rule.
- Double Top
The double top is a major reversal pattern that is formed after an extended uptrend. The pattern is formed of two consecutive peaks that are probably equal, with a trough in-between.
Though there can be variations, but the classic double top marks at least an intermediate trend change from bullish to bearish, if not long-term. Many potential double tops can form along the way up, but until key support is broken, a reversal cannot be confirmed. To clarify, we will look at the main points in the formation and then brief through an example.
Prior Trend: With any reversal pattern, there must be a prevailing trend to reverse. In the case of the double top, a significant uptrend of several months should exist.
First Peak: The first peak should mark the highest point of the current trend. As such, the first peak is fairly normal and the uptrend is not in question at this time.
Trough: After the first peak, a decline takes place that typically ranges from 10 to 20%. Volume on the fall from the first peak is usually not significant. The lows are sometimes rounded or drawn out a bit, which can be a sign of tepid demand.
Second Peak: The rise from the lows usually happens with low volume and meets resistance from the previous high. Resistance from the previous high should be expected. Even after meeting resistance, only the possibility of a double top exists. The pattern still needs to be confirmed. The time period between peaks can vary from a few weeks to many months, with the norm being 1-3 months. While exact peaks are preferable, there is some leeway. Usually a peak within 3% of the previous high is adequate.
Decline from Peak: The subsequent decline from the second peak should witness an expansion in volume and/or an accelerated descent, perhaps marked with a gap or two. Such a decline shows that the forces of demand are weaker than supply and a support test is imminent.
Support Break: Even after trading down to support, the double top and trend reversal are still not complete. Breaking support from the lowest point between the peaks completes the double top. This too should occur with an increase in volume and/or an accelerated descent.
Support Turned Resistance: Broken support becomes potential resistance and there is sometimes a test of this newfound resistance level with a reaction rally. Such a test can offer a second chance to exit a position or initiate a short.
Price Target: The distance from support break to peak can be subtracted from the support break for a price target. This would infer that the bigger the formation is, the larger the potential decline.
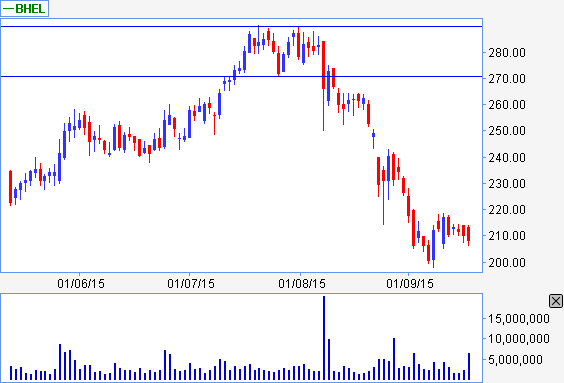
In the above chart of BHEL in recent past, the highs were not exactly but almost same. The first high was of 290 and the other is of 289.65. The trough of the pattern was at 271. After the breakout, it achieved the target of 252 on the same day.
Though it should not be assumed, that price target will get achieved same day. It may take much longer.
